Trade Route Risk
The Strait of Hormuz exposure behind the freight hedge
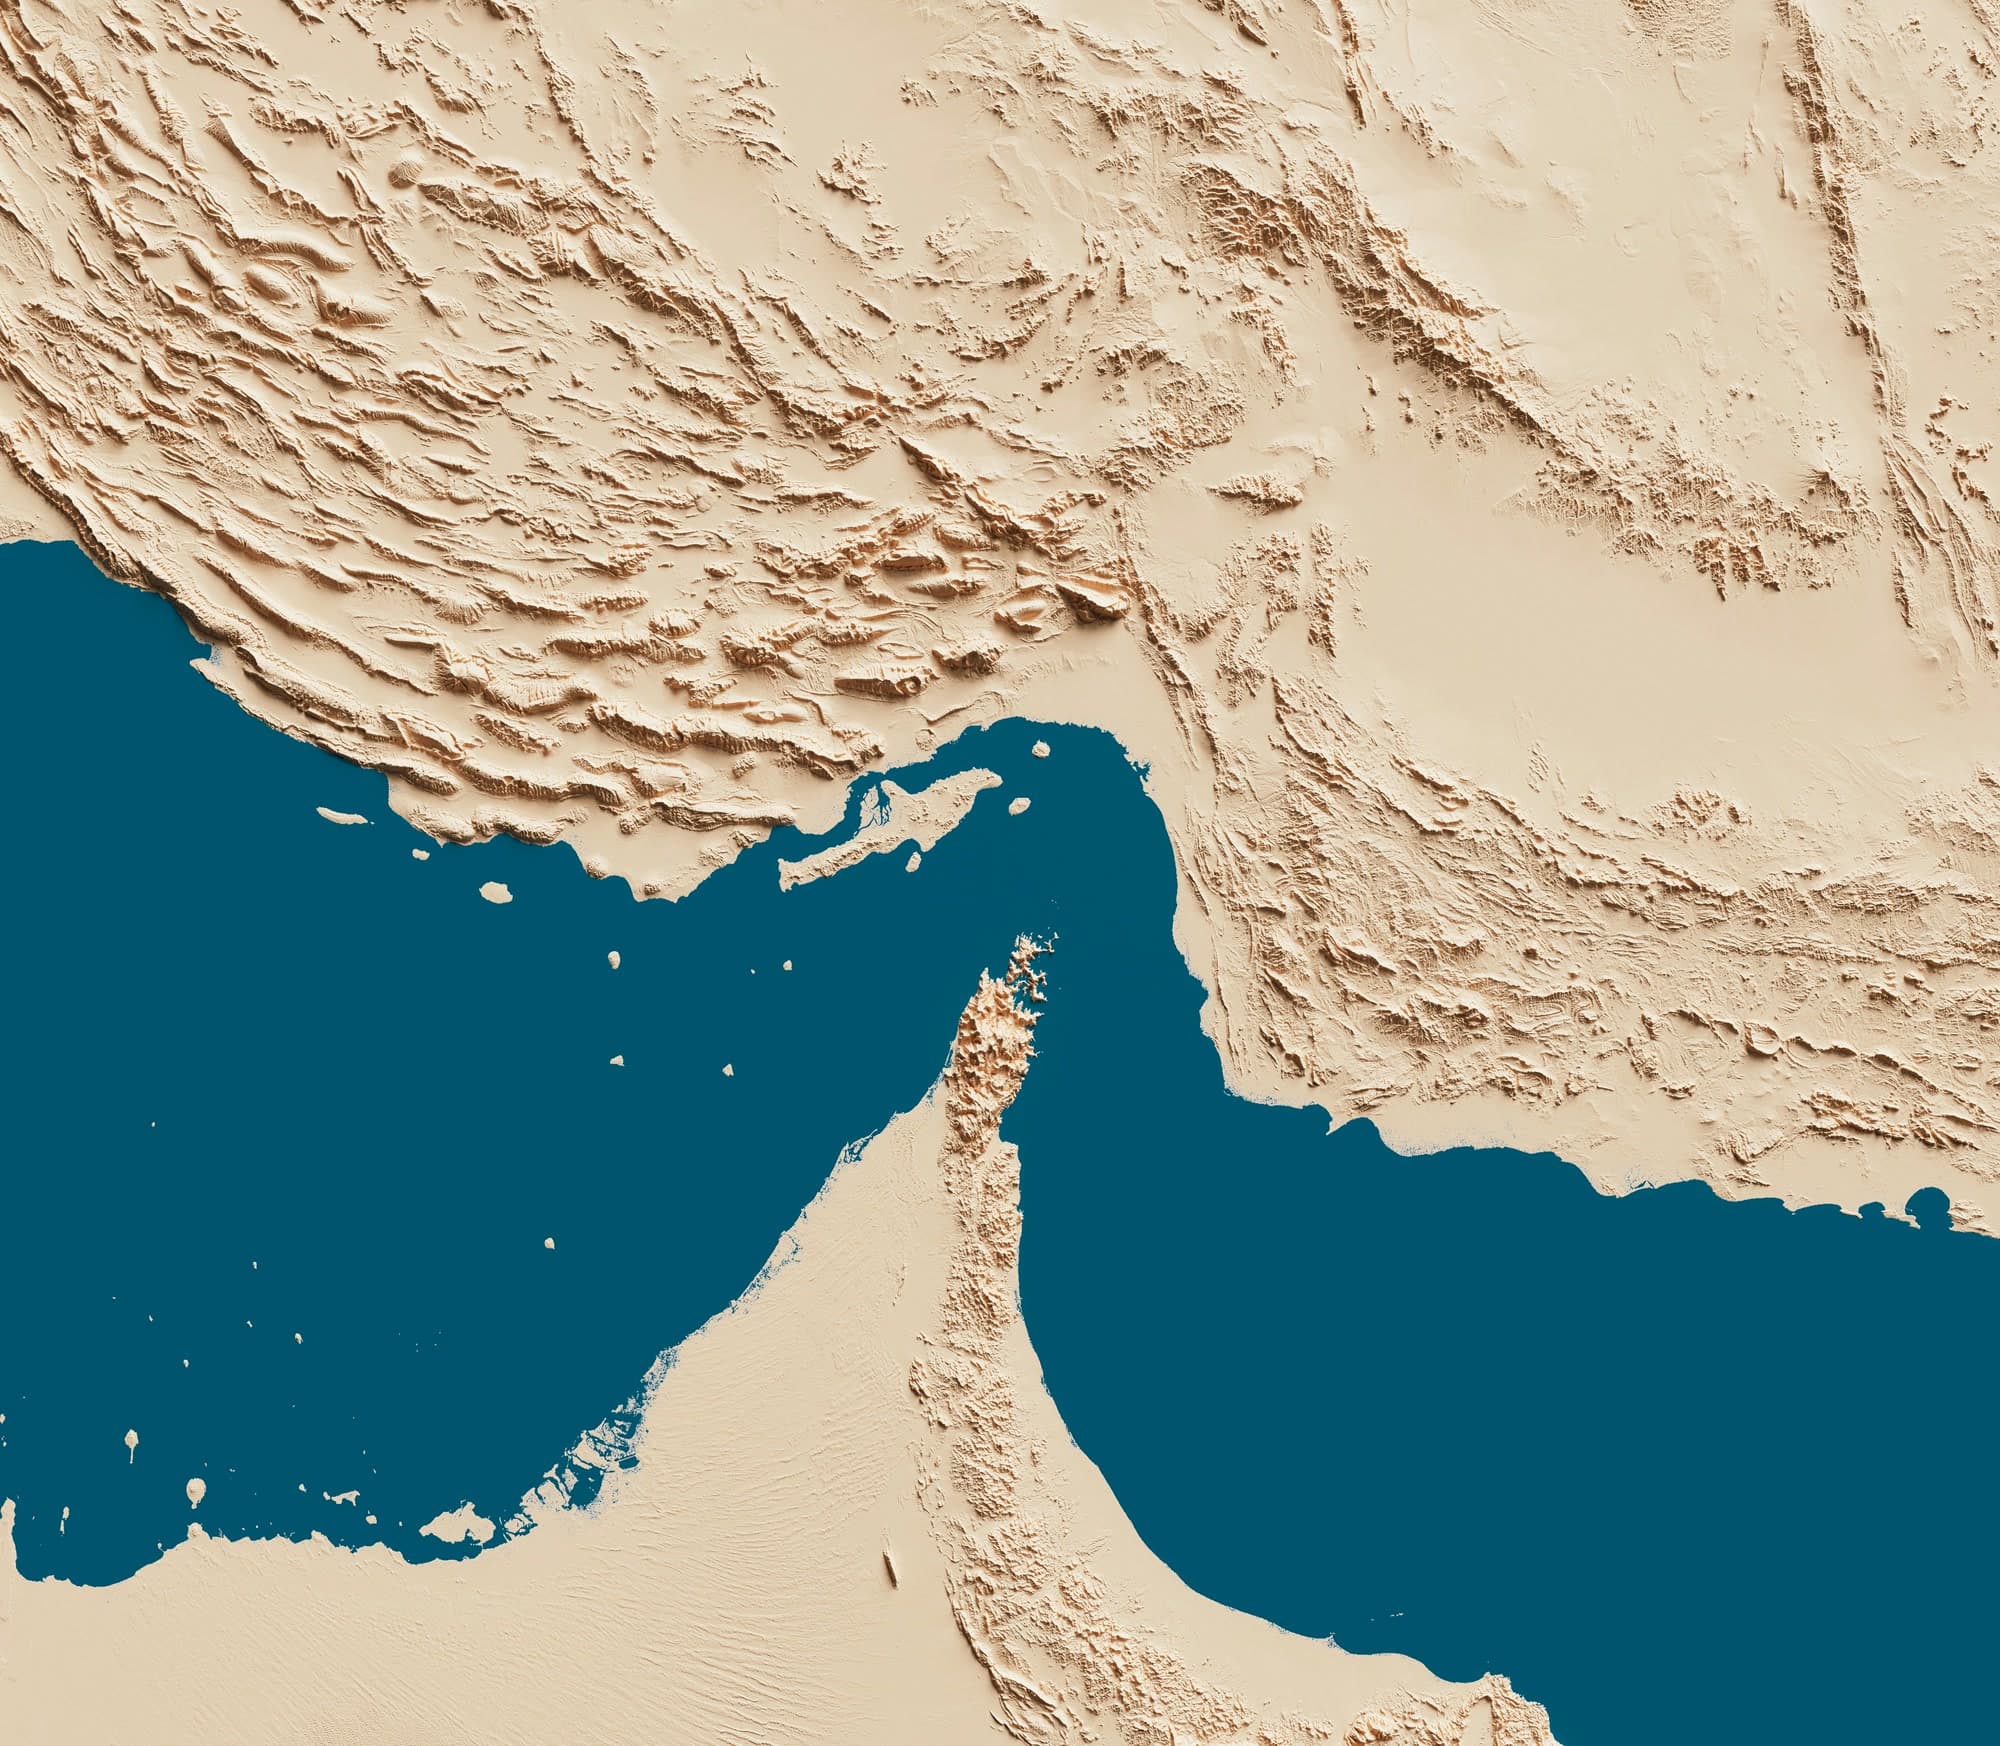
One waterway carried a fifth of the world’s oil until passage broke down in February 2026. EIA now prints 4.9 million barrels a day through Hormuz against 21.6 million before the war. Freight markets already offer a liquid hedge for one consequence: the cost of moving a barrel. They leave a different exposure when the voyage itself stops working.
4.9M b/d1
Oil through Hormuz in 2Q 2026, against 21.6 million barrels a day in 4Q 2025 before the war
TD3C2
Baltic benchmark for a 270,000-tonne Middle East Gulf-to-China VLCC voyage
~5203
Commercial vessels still stranded inside the Gulf when the June truce expired
TD344
New Gulf of Oman-to-China route introduced after Middle East Gulf trade was disrupted
Passage broke down in February
US and Israeli strikes on Iran on 28 February 2026 preceded a collapse in commercial passage through the Strait of Hormuz. Tanker traffic fell close to zero. Brent passed $100 a barrel on 8 March and later reached $126.[5]
Normal passage did not return. A sixty-day memorandum signed in Islamabad on 17 June cleared part of the stranded backlog and moved about 374 million barrels out of the Gulf. The window expired on 17 August without a broader agreement.[3]
Before the war, EIA counted 21.6 million barrels of oil a day through Hormuz in the fourth quarter of 2025, along with 10.5 billion cubic feet a day of LNG. By the second quarter of 2026, those figures had fallen to 4.9 million barrels and 0.8 billion cubic feet.[1]
The economic exposure did not move in one line. Crude prices repriced. Freight rates repriced. Insurance repriced. Ships waited, rerouted or stopped sailing. A company that depends on a cargo arriving through Hormuz can carry all four risks at once.
Freight already has a hedge
A charterer worried about higher tanker rates does not need a new derivative.
Baltic Forward Freight Agreements let shipowners, charterers and cargo owners trade the future price of freight against Baltic route assessments. A cargo owner exposed to rising freight can buy the corresponding FFA. A shipowner exposed to falling freight can sell it. Baltic advises users to choose the FFA most closely correlated with their physical exposure.[6]
For crude moving from the Middle East Gulf to China, the relevant benchmark is TD3C, based on a 270,000-tonne VLCC voyage. ICE lists cash-settled TD3C futures, balance-of-month futures and average-price options.[2][7]
The market has several advantages over a bespoke bilateral hedge. Participants can trade months, quarters or years, reverse a position by taking the opposite side and clear the trade through established clearing houses. Baltic says almost all FFAs now go to a clearing house after execution.[8][9]
For a charterer whose loss comes from paying more for freight, TD3C can give a close hedge.
If the physical freight bill rises with the TD3C assessment, a long TD3C position gains with it. An option can cap the freight rate while leaving the buyer exposed to lower rates if the market falls.[10]
A transit contract adds little to that problem.
A benchmark voyage can stop being a normal voyage
The February disruption exposed a harder problem. TD3C asks brokers to assess the price of moving a VLCC from the Middle East Gulf to China. That voyage requires passage through Hormuz.
By late March, Baltic described Hormuz transits as “extremely limited.” TD3C still printed at WS366. Baltic introduced TD34, a new 270,000-tonne Gulf of Oman-to-China assessment, to provide transparency after disruption to trade from the Middle East Gulf. TD34 printed at WS197 during the same week.[4][11]
The new route starts outside the strait. Baltic said it did not intend TD34 to replace TD3C.[4]
The difference matters to a hedge. An FFA settles against the assessed price of freight. A company can lose money because freight becomes expensive, but it can also lose money because a vessel waits, a fixture cannot perform, a cargo arrives late or replacement supply has to come from somewhere else.
Those costs need not move one-for-one with the monthly freight assessment.
The disagreement has reached the English High Court. Mercuria sued Baltic in April, alleging that TD3C no longer reflected market reality after Hormuz became effectively closed and that continued publication caused losses in physical freight and freight derivatives. Baltic denies the allegations. It says lawful shipping continued, its panelists could still assess the route and TD3C remained a valid benchmark produced under its established methodology. The case remains contested.[12][13]
The dispute does not show that TD3C failed. It shows the basis question a freight user has to answer: does the company’s loss follow the assessed freight rate, or does it follow whether the route performs?
The cost of a voyage and the failure of a voyage
Consider a refiner with Gulf crude scheduled for delivery.
If Hormuz remains open and VLCC rates double, its freight bill rises. A TD3C hedge can offset that increase.
If passage falls for two weeks, the refiner can face a different bill: waiting time, demurrage, replacement barrels and late delivery. Its vessel may sit outside the lane while a monthly freight assessment continues to print. The refiner may also have hedged its crude price already.
A shipowner has the other side of the same operational problem. The owner can hedge the market value of freight with an FFA and still have a hull idle on the wrong side of the strait.
War-risk insurance covers another piece. It responds to insured loss, damage and detention under the policy terms. During the disruption, cover remained available at sharply higher prices even as owners declined some voyages on safety grounds.[14]
Freight derivatives, commodity futures and marine insurance each settle against their own variable. None uses the amount of traffic through the waterway as its settlement variable.
The variable left over
EIA already measures oil and LNG moving through Hormuz. Ship-tracking providers count vessels and reconstruct routes from AIS and other data. EIA notes that AIS signals around the strait have been unreliable since the end of February, so its estimates also use origin, destination and route analysis.[1]
That creates a separate contract variable: throughput.
A contract can define a vessel class, observation window and baseline, then pay when qualifying traffic falls below a stated level. A crude importer might hedge barrels moving through the strait. A charterer might use VLCC transits. An industrial buyer could choose a window around scheduled deliveries.
Basis remains. Aggregate traffic can fall while one company’s vessel gets through. A particular vessel can also be delayed while aggregate traffic stays above the trigger. A narrower vessel class, route definition and observation window can bring the settlement variable closer to the physical exposure.
The point is not to replace TD3C. A company whose P&L follows freight should use the freight market.
The residual appears when the P&L depends on the route continuing to function.
A desk can hedge Brent and TD3C, insure the hull and still lose money when passage through Hormuz falls far enough to strand cargo, break a delivery schedule or force replacement supply. That remaining exposure can be written against the traffic itself.
Discrete structures event-linked contracts for trading desks, charterers and businesses whose delivery obligations depend on a route.
Sources
- 1US Energy Information AdministrationGlobal Energy Security Data: oil and LNG volumes through world chokepoints, Short-Term Energy Outlook — August 2026
- 2Baltic ExchangeBaltic tanker route assessments: TD3C, 270,000mt Middle East Gulf to China
- 3The NationalHormuz traffic falls to single digits as 60-day deadline for US-Iran MoU expires — August 2026
- 4Baltic ExchangeCircular 17/26: New Index — TD34 (Dirty 270k Gulf of Oman to China) on Public Trial — March 2026
- 5Congressional Research ServiceThe Strait of Hormuz: security developments and impacts on oil, gas, and other commodities — August 2026
- 6Baltic ExchangeWhy use FFAs?
- 7ICE Futures EuropeTD3C FFA Middle East Gulf to China (Baltic) futures, Balmo futures and average-price options
- 8Baltic ExchangeFeatures of an FFA Contract
- 9Baltic ExchangeRole of the Clearing House
- 10Baltic ExchangeWhat are FFA options?
- 11Baltic ExchangeTanker Report, Week 13 — March 2026
- 12ReutersTrader Mercuria sues Baltic Exchange over Hormuz freight losses, court filing shows — May 2026
- 13Reuters / Baltic ExchangeBaltic Exchange defends its tanker rates as reliable during Iran war; Claim from Mercuria Energy Trading — June 2026
- 14Lloyd's Market Association / shipping-market reportingWar-risk cover and vessel-safety conditions during the 2026 Hormuz disruption — March 2026
Discrete structures similar exposures the same way.
Contact Discrete for institutional inquiries.